Finance
Our Sankey editor turns the complexity of a P&L into easily understandable financial insights by highlighting:
where revenues come from (e.g., product types or geographies),
how revenues relate to the cost of goods sold,
how the gross margin offsets fixed and operational expenses to generate earnings or losses,
what are the main expenses of the business,
what are the variations (year over year or compared to Budget).
Overall, Sankey diagrams allow to quickly and visually grasp the drivers of a P&L for better decision making.
Whether you are an executive leader or a financial analyst, working in accounting or in investors relations, incorporating a Sankey diagram in your tool box will enhance your financial communication.
Ditch the traditional tab...
and stand out with a Sankey chart!
Lots of figures with no visual impact
Difficult to tell a story
Identify right away the key drivers
Tell a narrative by reading from left to right
How to tell a financial narrative with a Sankey chart? See our suggestions below for the P&L.
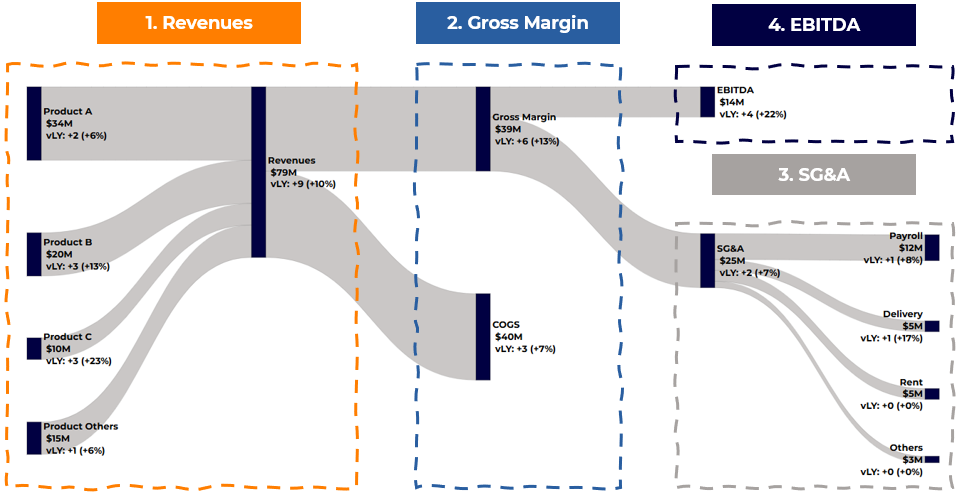
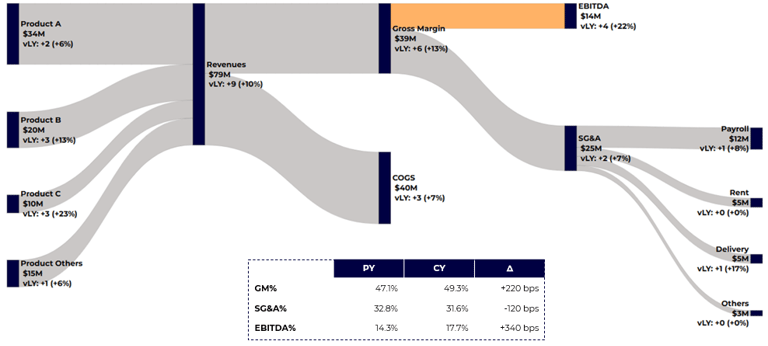
A Sankey chart gives a 360-degree view of a P&L while highlighting the key drivers. It is a great way to introduce any audience to the revenues and costs of an entity from a high-level perspective, especially when working cross-functionally with teams not familiar with financial reporting.
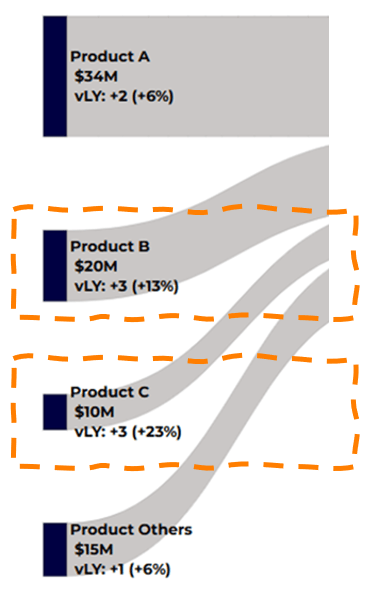
Highlight what are the main Revenues drivers. When a company generates cash income from a variety of streams (product, services, geographies, etc.), a Sankey chart can be particularly beneficial.
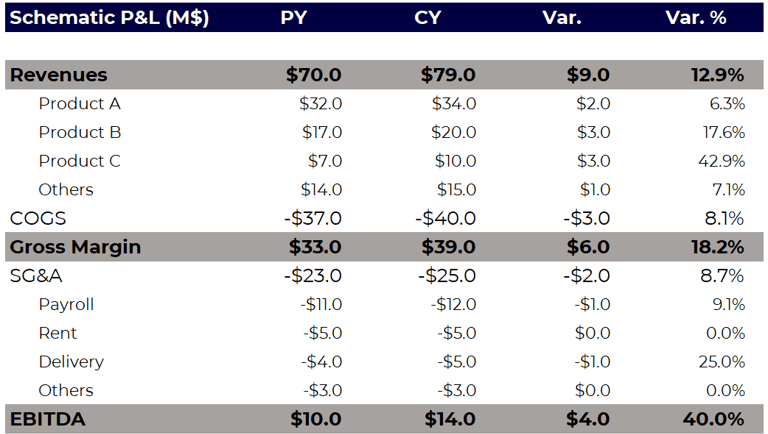
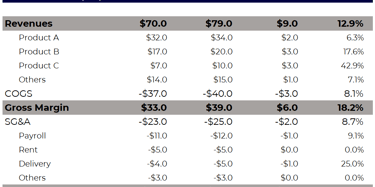
Mention the YoY variation and lay emphasis upon the most noticeable changes. In the schematic illustration above, with the highest growth both in absolute amounts and %, Product B and Product C are the main drivers of the YoY increase. While your next slides should explain the variation causes with higher granularity (volume, mix, pricing), at this stage, you can progressively introduce the audience to the main drivers and changes while connecting the dots with the other P&L components (costs of goods sold, operating costs).
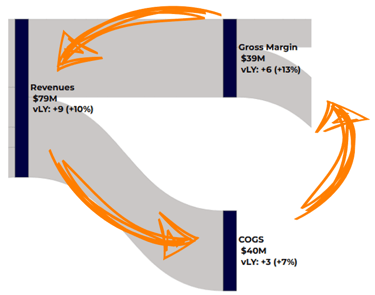
Explain how the COGS and the Gross Margin relate to the Revenues.
If COGS increased in line with Revenues, the sales variation is margin-neutral (the margin % remains stable),
If COGS increased under proportionally compared to Revenues, the sales variation is incremental to the margin % (e.g., increase due to a more profitable product mix and/or to procurement optimization),
If COGS increased over proportionally compared to Revenues, the sales variation is decremental to the margin % (e.g., decrease due to a less profitable product mix and/or to higher costs that could not be passed one-to-one to end customers).
In the schematic illustration above, Revenues increased by +10.2% while COGS increased under proportionally by +7.0%. The Revenues variation is incremental to the gross margin %:
In Prior Year, the Gross Margin % was 47% with $33M GM out of $70M Revenues.
In Current Year, the Gross Margin % is 49% (+200 bps) with $39M GM out of $79M Revenues
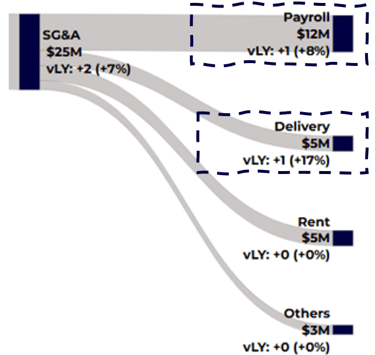
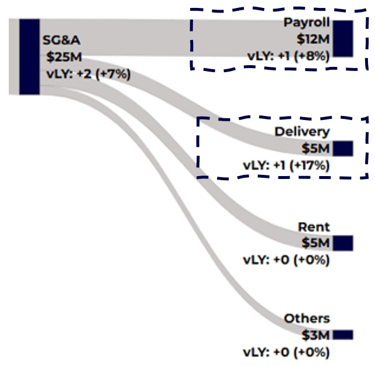
Once the key drivers of the Gross Margin have been highlighted, move on to the operating expenses (SG&A) and highlight what the main contributors/changes are.
In the schematic illustration above, Payroll and Delivery are the main contributors with the highest YoY variations.
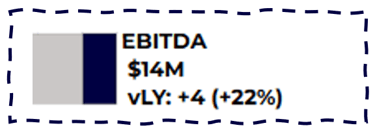
Finally, summarize how the Revenues, Gross Margin, and SG&A expenses contribute to the EBITDA, and what are the key drivers of the YoY change.
In the schematic illustration above:
The EBITDA of $14M results from a Gross Margin of $39M and SG&A expenses of -$25M.
The YoY variation of +$4M (+22.2%) is driven by incremental sales generating +$6M of Gross Margin and higher SG&A of -$2M.
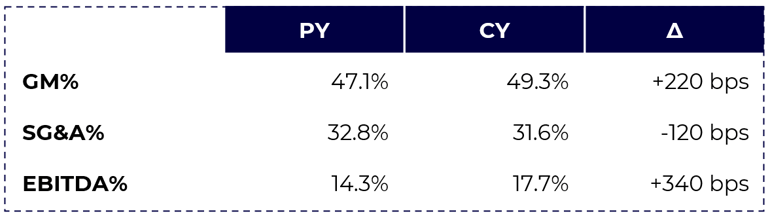
Last but not least, the SG&A% and EBITDA% highlight whether operations are more efficient and whether profitability improved.
The company operationally leveraged its P&L as its SG&A% decreased by 120 bps (from 32.8% in PY to 31.6% in CY).
The company became more profitable as its EBITDA% increased by +340 bps (from 14.3% in PY to 17.7% in CY).
1

2

3
4


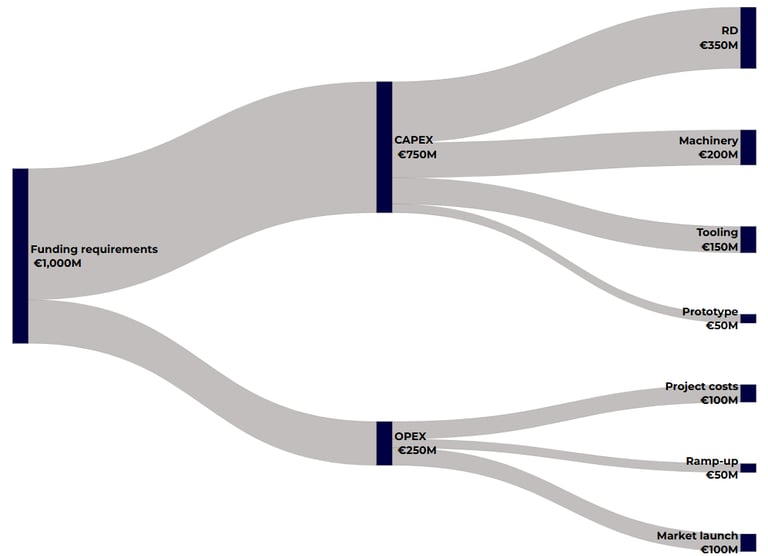
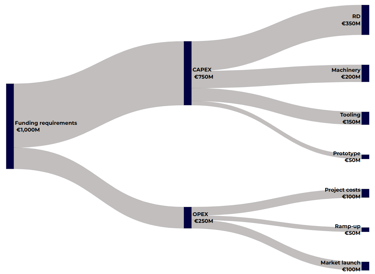
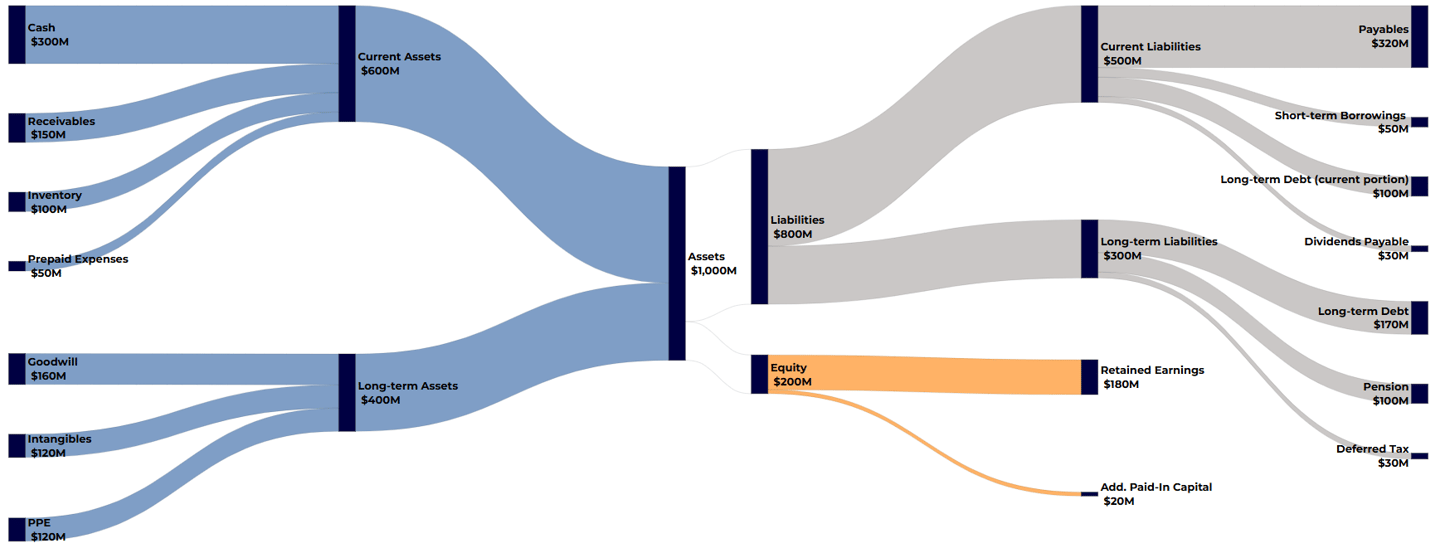
What about the Balance Sheet?

What about Funding Requirements?